Report templates and calculations
The six performance report templates, binding slots to tags, how average, counter difference, duration and alarm calculations are made from the archive, periods, slices and the preview.
A template brings the content slots and the default period of the report ready-made. Tags are empty; you bind the slots yourself. A report created from a template is an ordinary report: you can add and delete slots and change their order and titles.
Six templates
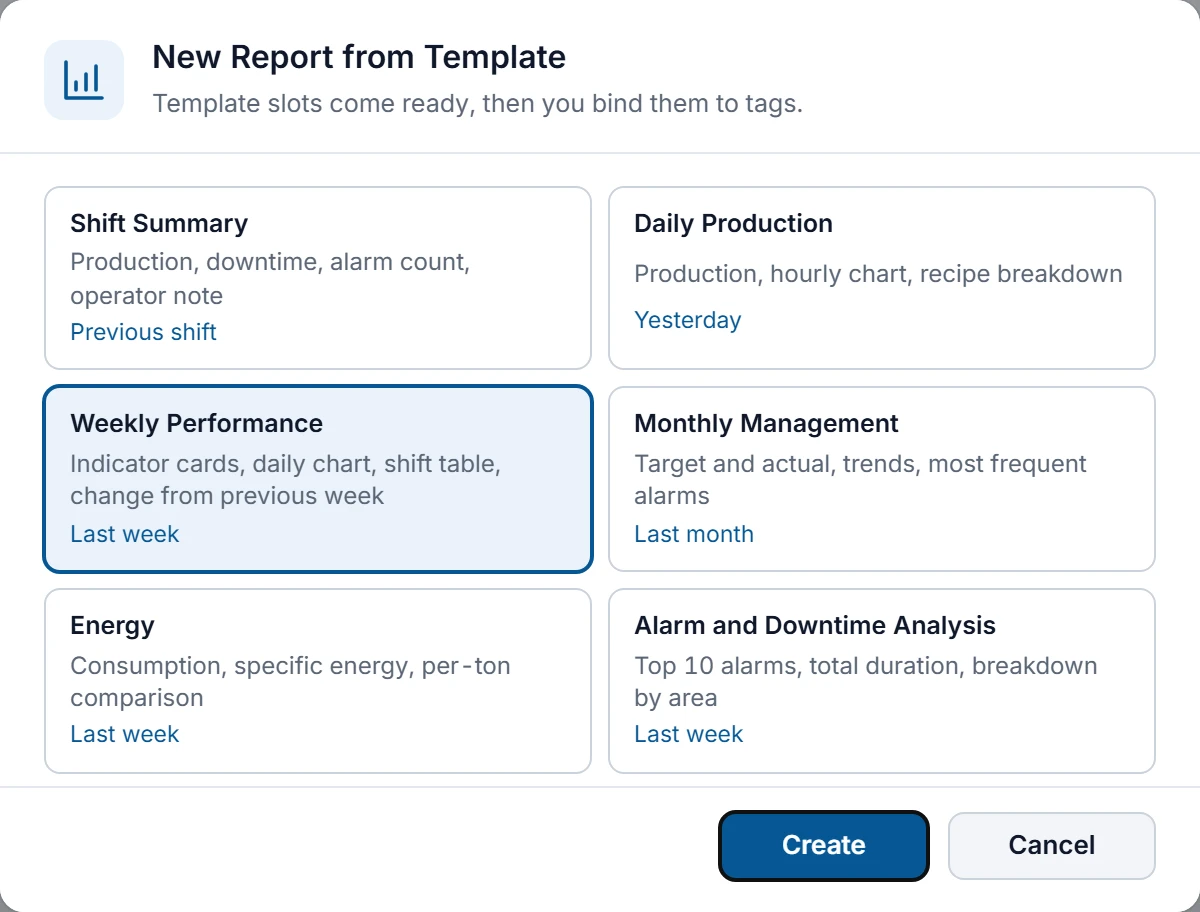
| Template | Period | Indicator cards | Chart, table, list |
|---|---|---|---|
| Shift Summary | Previous shift | Production, Downtime, Alarm count, Average speed | Hourly production, Most frequent alarms, Operator note |
| Daily Production | Yesterday | Total production, Downtime, Energy consumption, Alarm count | Hourly production, Shift table, Recipe breakdown |
| Weekly Performance | Last week | Production, Quantity produced, Specific energy, Quality | Daily production, Shift table, Most frequent alarms |
| Monthly Management | Last month | Monthly production, Quality, Downtime, Energy consumption | Target and actual, Trends, Most frequent alarms (10 rows) |
| Energy | Last week | Total consumption, Production, Specific energy, Peak power | Power trend, Daily consumption, Per-ton comparison |
| Alarm and Downtime Analysis | Last week | Total alarms, Total alarm time, Average duration, Longest alarm | Daily alarm count, Top 10 alarms, By area, By class |
Alarm and Downtime Analysis needs no tags: it calculates all values from the alarm log.
Slot types
The Add slot… list offers six types. Consecutive indicator cards are arranged in rows of four; two blocks whose Width is Half page stand side by side.
| Type | Shows | Specific fields |
|---|---|---|
| Indicator card | Single value, difference from the previous period, target. | Calculation, Tag, Divisor tag, Unit, Decimals, Target, Good direction, Compare |
| Bar chart | One bar for each slice; the target is a dashed red line. A slice with no value is drawn hatched. | The indicator card fields (except Good direction and Compare) and Breakdown |
| Line chart | Slice values of one or more tags. If their units differ or their ranges differ by more than 5 times, the curves are split into separate panels. | Calculation (no alarm calculation), Tags, Breakdown, Unit, Decimals |
| Table | Rows are slices, columns are tags. If there is more than one row, a Total row is added for the counter difference, total, time, alarm count and alarm duration columns. | Columns (title, calculation, tag), Rows |
| Alarm list | Alarm summary of the period: count and duration. | View (Most frequent alarms, By area, By class), Row count (1 – 50) |
| Text | Fixed text, or the last record of a text tag in the period. | Tag, Fixed text |
The By area view uses the Fault location field of the alarm, and the By class view uses the alarm class. If Fault location is empty, the row shows (not specified).
Binding slots to tags
- Select the slot
On the Design tab, select it in the list on the left or click the block directly in the preview. In the list, a yellow dot marks a slot with no bound tag.
- Select the calculation
The Calculation list comes ready-made in the template; change it if it does not suit the tag.
- Select the tag
Click the Tag field and find the tag in the tag selector. The tag field does not appear for alarm calculations.
- Check the archive state
A green In archive: … or yellow Not archived: the report shows "no data" badge appears below the fields. The badge does not appear on line chart and table slots; for these, see the F7 list.
- Set the unit, target and direction
If Unit is empty, the unit of the tag is used. Good direction determines whether an increase appears green or red. Target adds a target row to the card and a line to the bar chart.
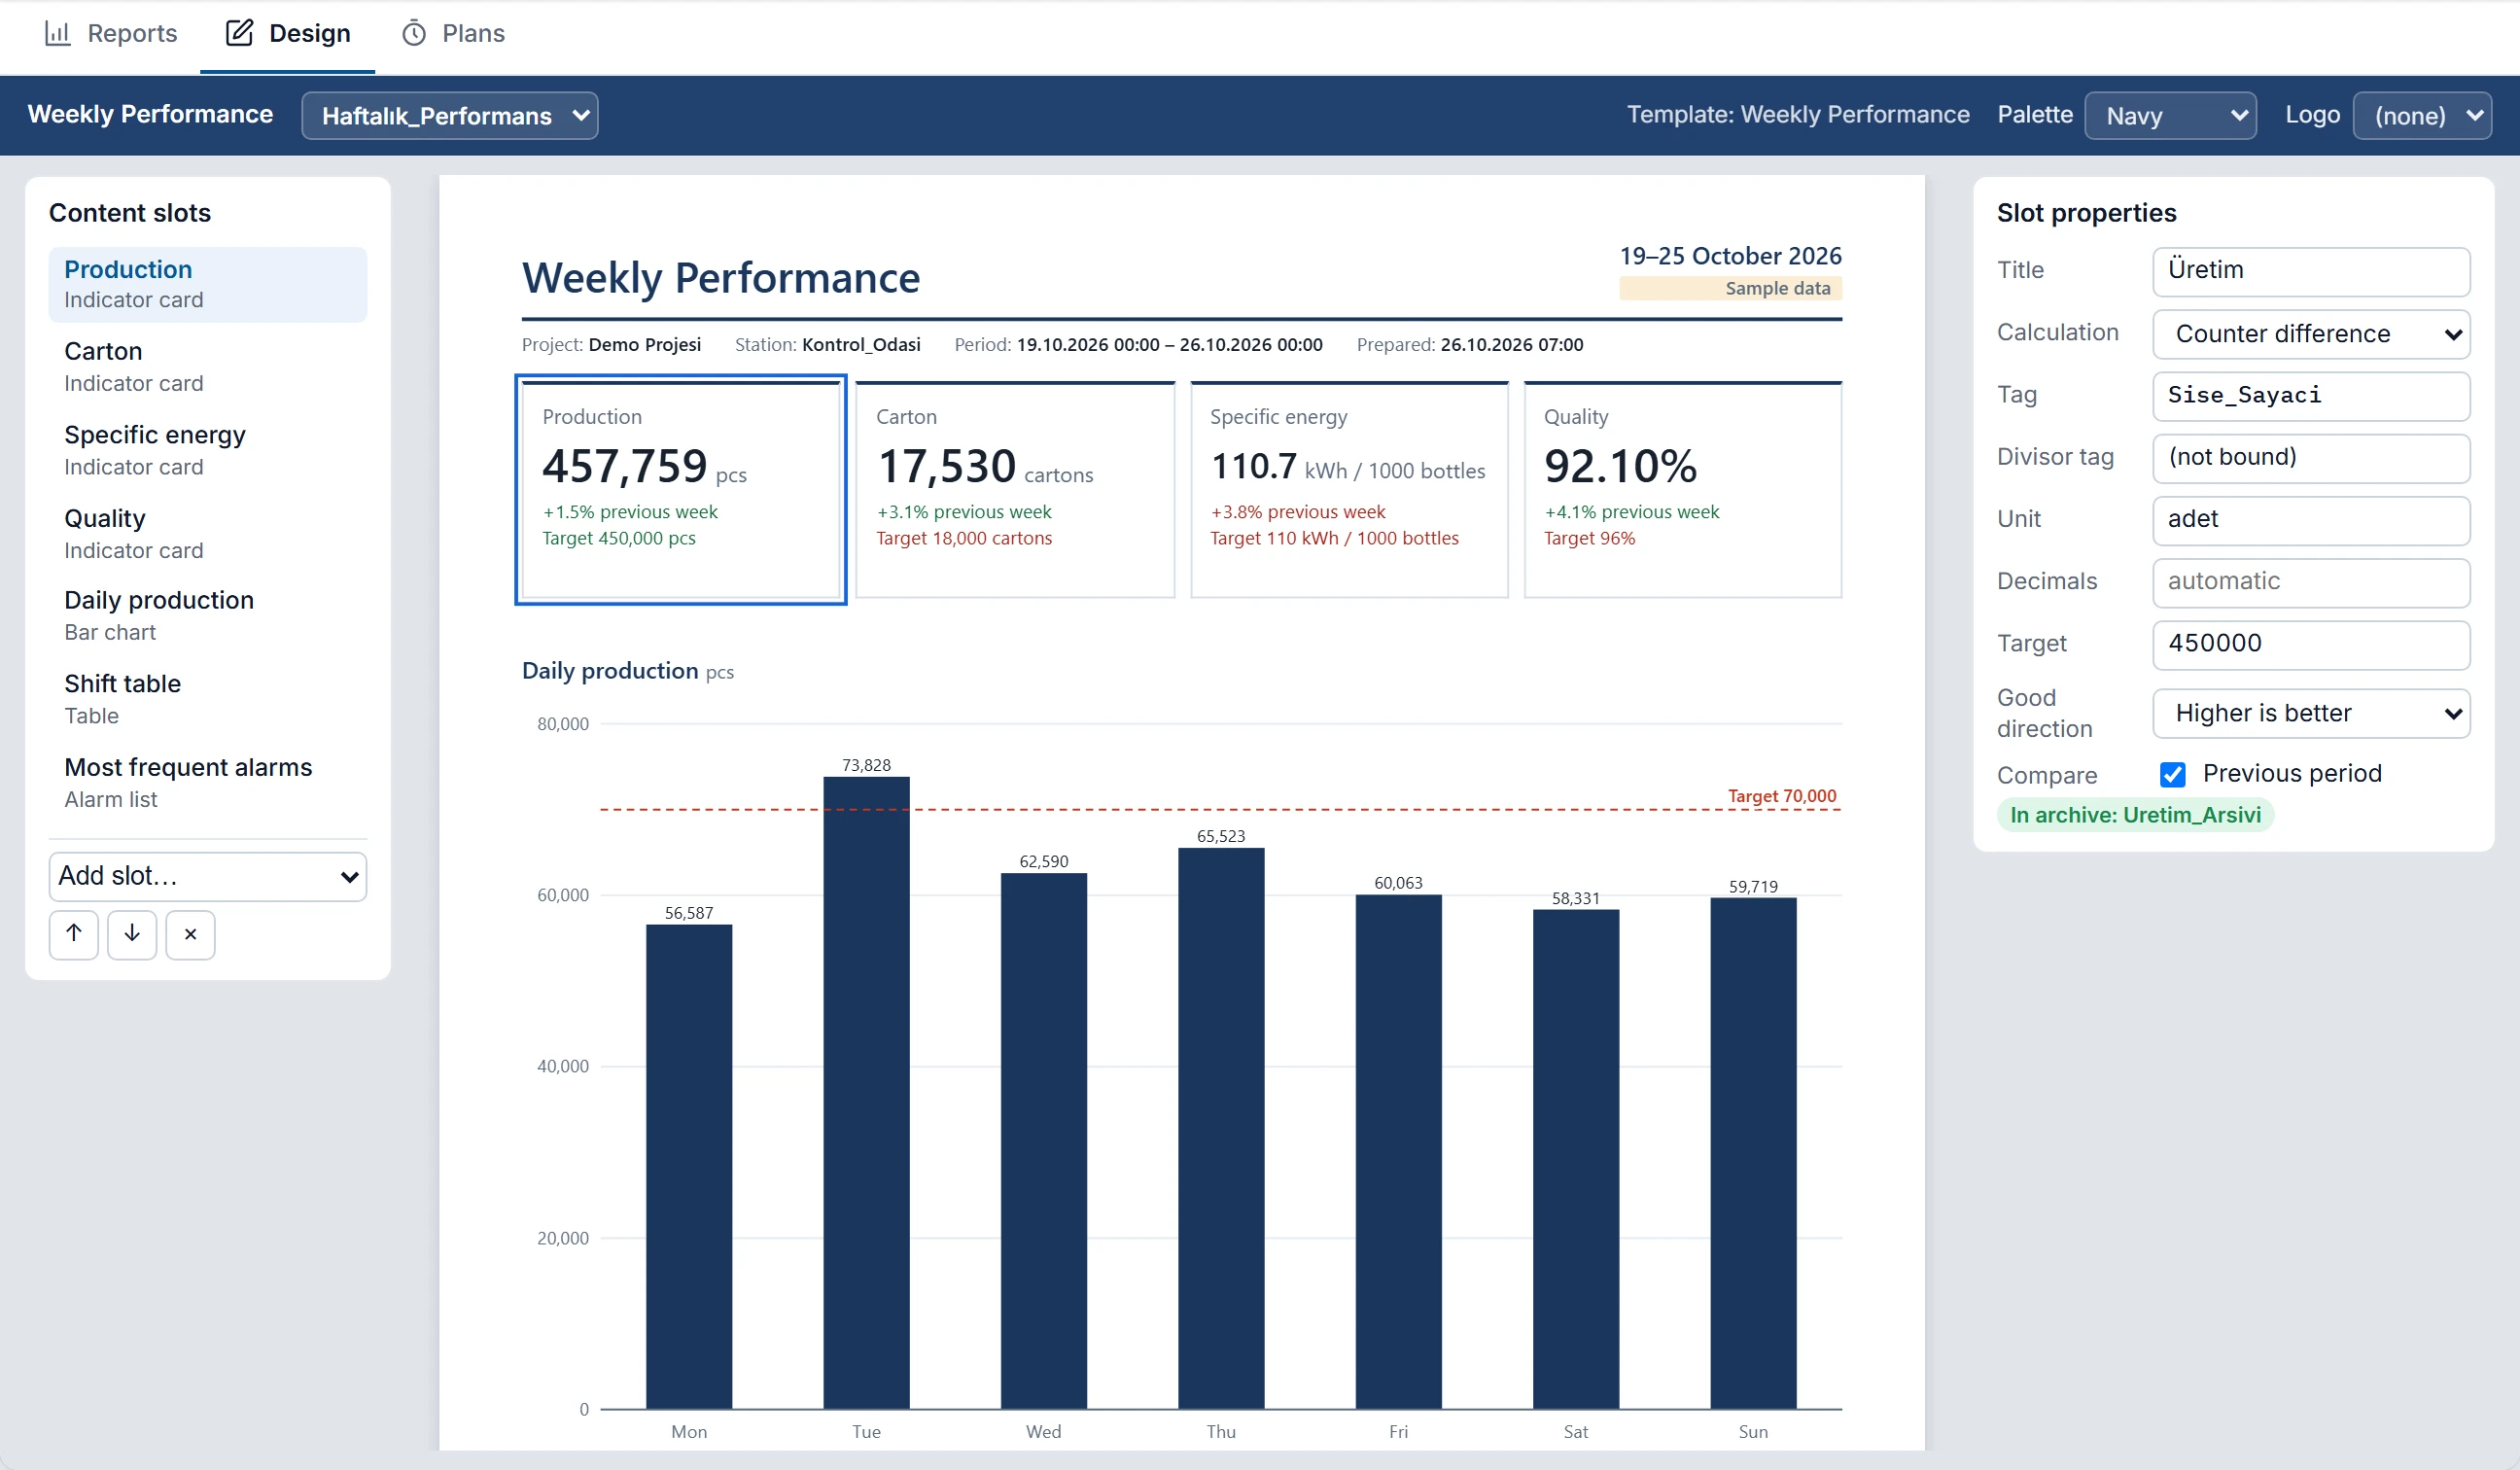 123456
- Content slots — select, sort, add, delete.
- A4 preview — drawn with sample data; click a slot to select it.
- Calculation — how the value is calculated from the archive.
- Tag — click, then select in the tag selector.
- In archive — the tag is logged. If a yellow Not archived appears, the report shows "no data".
- Palette and Logo — the colors of the report and the image in the header.
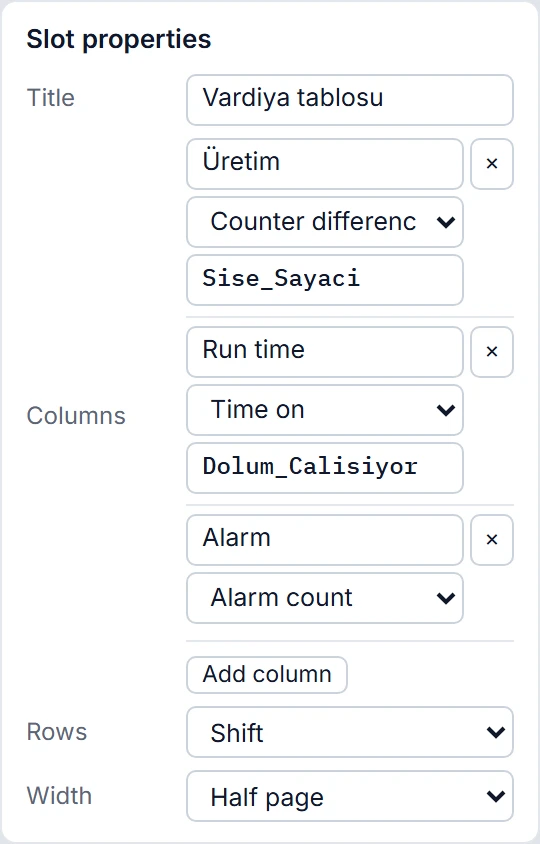
In time calculations (Time on and alarm durations), Target is entered in hours. Table columns have no unit and target fields.
Calculations
Calculations are made from the archive rows of the selected period or slice that are not of bad quality.
| Calculation | How it is calculated | What for |
|---|---|---|
| Last value | The last good value of the period. | Text tag, end-of-period level. The only calculation that can be used on a text tag. |
| Average | With cyclic logging, the arithmetic mean of the samples. For a tag logged On change or With trigger tag, the time-weighted average: each value is considered valid until the next row. | Temperature, speed, quality percentage. |
| Min, At most | The smallest and largest sample in the period. With sparse logging, the value at the start of the period also counts. | Peak power, lowest pressure. |
| Total | Sum of the sample values in the period. It is not multiplied by time. | A quantity tag that writes one row per event. |
| Counter difference | Sum of the positive increases between consecutive good samples. | Production, energy and flow counters. |
| Time on | Total time during which the value was other than 0. Each sample is considered valid until the next sample. | Running and downtime bits. |
| Alarm count | Number of alarms that came in during the period. | Calculated from the alarm log; no tag is required. The duration is the part of the alarm within the period: an alarm that has not ended is cut off at the end of the period. |
| Total alarm time | Sum of the alarm durations. | |
| Average alarm duration | Total time ÷ alarm count. | |
| Longest alarm | The longest single alarm. |
When a counter resets
Counter difference skips negative steps. A counter that resets daily is therefore totaled correctly:
Arşiv:  90   100   0   10   30
Adım:      +10  atla  +10  +20     Sonuç: 40
The increase up to the first sample after a reset is not counted. For example, if 5 is read after 100, this 5 is not added. The loss is at most one sampling interval. The same rule prevents 99.9 from being added when a noisy counter drops from 100.0 to 99.9 and rises again. If the loss matters, archive the counter more often.
Time, downtime and availability
- Time on measures the time during which the value is not 0. In the Downtime slot, bind a tag that is 1 while the line is stopped. If you only have a running bit, that tag gives the running time: produce the inverse bit in the PLC or with an internal tag.
- If a numeric tag other than Bool is bound, every value other than 0 counts as “on”.
- There is no ready-made calculation for availability or OEE. Calculate the ratio in the PLC or in an internal tag, archive it, and select Average in the slot.
Ratio: Divisor tag
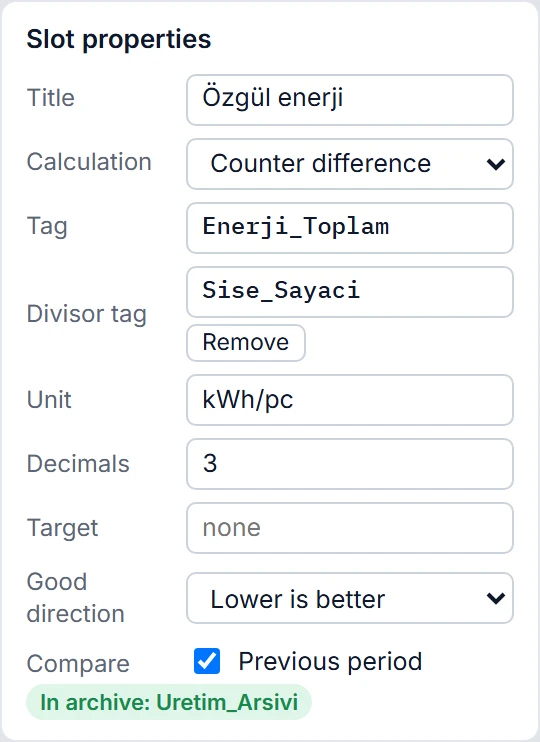
An indicator card and a bar chart can give the ratio of two tags. If a Divisor tag is selected, the same Calculation is applied to both tags and the result is first ÷ second. Example: difference of the energy counter ÷ difference of the production counter = specific energy. If the divisor is 0 or missing, no data is shown. A ratio does not get a unit automatically; enter it in the Unit field.
What “no data” means
The report does not write 0 for a field whose value is unknown. It writes no data; in a bar chart the slice is hatched, and in Excel the cell contains the same text. In the Report Archive, the row shows the note Some fields have no data. Periods when Live was closed are handled as follows:
- Each sample is valid until the next sample. If 1 was read at 08:00 and 0 at 10:00, it counts as 2 hours on even if there are no records in between.
- A bad-quality row makes the value unknown. The time up to the next good sample counts as neither on nor off. The counter skips this row and continues from the previous good sample.
- Start of a slice: if there is a sample before the slice, its value is carried into the slice. Otherwise the time up to the first sample is not counted.
- End of a slice: if there is a newer sample, or if the tag is logged infrequently, the value is held to the end of the slice. In cyclic logging, if Live has stopped, the record ends at the last sample.
- Single sample: time and counter difference cannot be calculated, so no data is shown. Two equal samples give a real 0.
- Alarm: if a slice has no alarms and Live was running during that slice, 0 is shown. If Live was closed, no data is shown.
Periods and comparison
The week starts on Monday. The comparison appears on indicator cards if Compare is selected: percentage difference and its direction. If the previous period has no value, the comparison line does not appear.
| Period | Scope | Compared with |
|---|---|---|
| Previous shift | The last shift that ended before the scheduled time of the report. | The shift before that. |
| Yesterday | Previous day 00:00 – 24:00. | The previous day. |
| Last week | Previous Monday – Sunday. | The week before that. |
| Last month | Previous calendar month. | The month before that. |
| Today, This week, This month | From the start of the period to the moment of production. | The beginning of the previous period, of the same length: half a week is not compared with a full week. |
The period is not a single setting of the report: Default period gives a new plan its initial value; the actual period is the one selected in Period in the plan or in Produce now.
Slices (breakdown)
| Breakdown | Result |
|---|---|
| Hour | Each hour is one slice. A monthly period produces more than 700 slices, and F7 warns about it. |
| Day | Each calendar day is one slice. |
| Shift | Each shift is one slice. The same shift on all days in the period is totaled in a single row. |
| Single row (item list) | Table only. Each column becomes a row: Item, Value, Share (percent). |
Preview
The A4 area in the middle draws exactly the layout to be printed: palette, logo, page breaks, slot order. The values shown, however, are sample data; Sample data appears at the top right. Studio has no archive, so these figures do not come from your project. To see real values, use Report archive… in the Produce now window in Live.
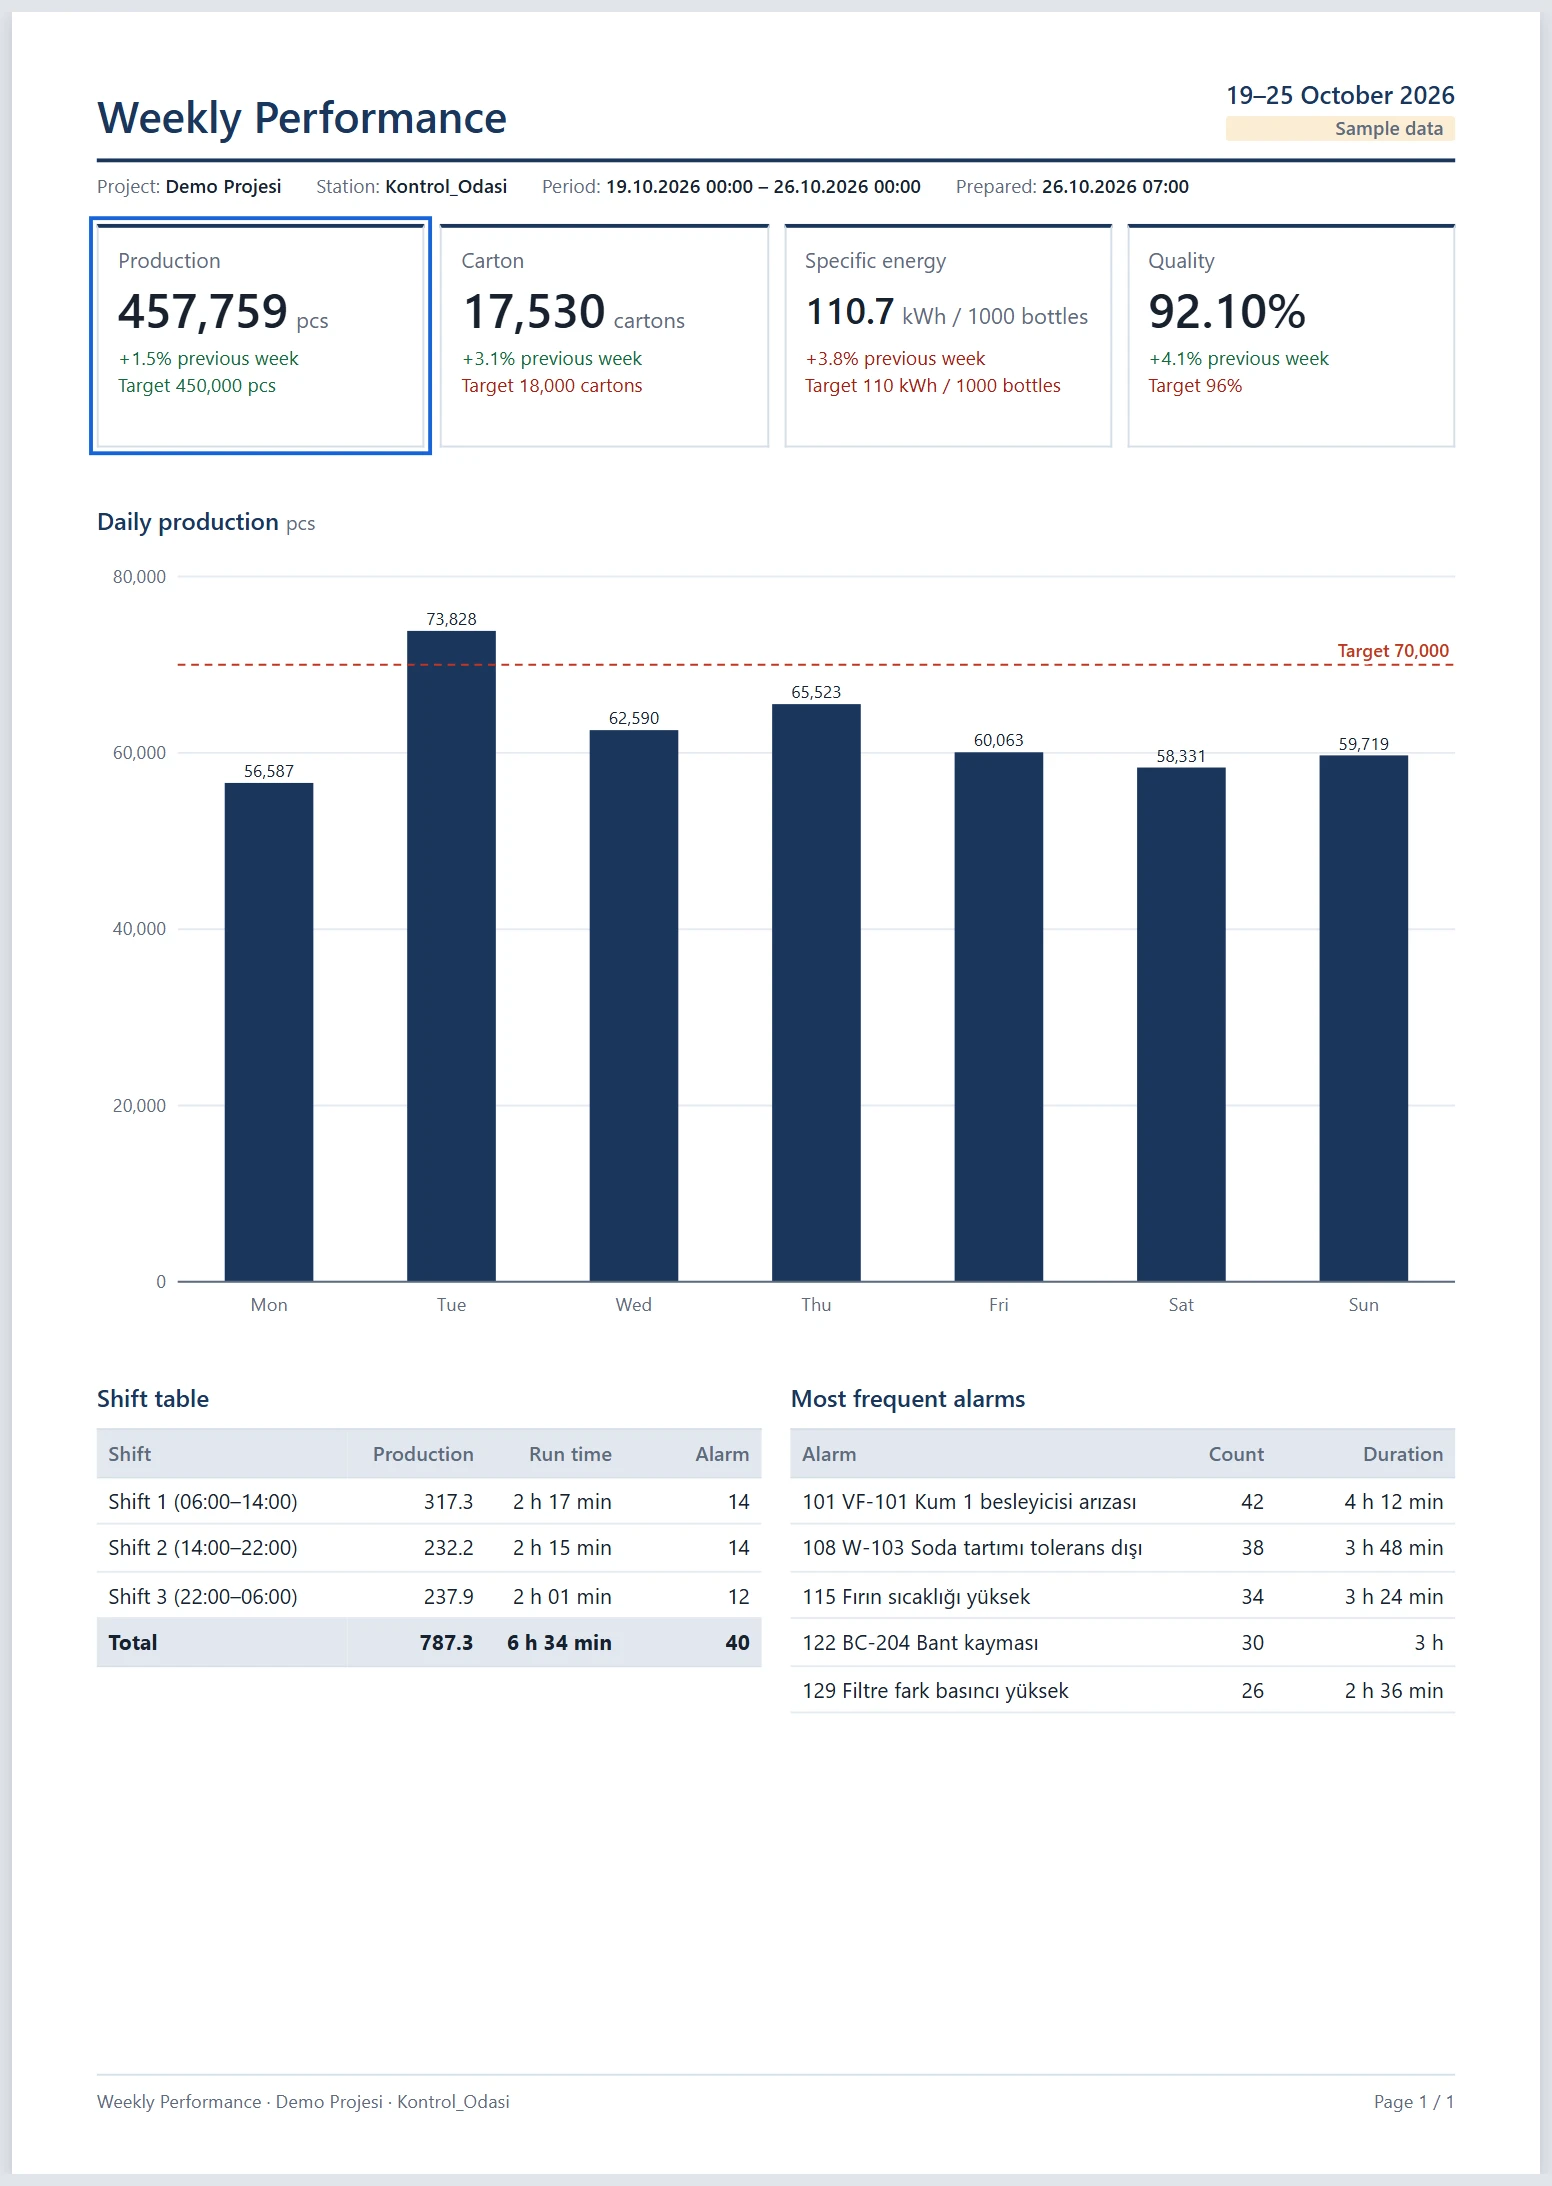
Palette (Navy, Graphite, Teal, Burgundy) and Logo are selected on the top bar. The logo list comes from the images of the project.
Check project messages
| Message | Solution |
|---|---|
| … is not bound: the report shows "no data". | Select a tag for the slot. |
| "…" is not archived: the report shows "no data". | Add the tag to an archive in the Historical data section. |
| … has been deleted. | Select another tag for the slot. |
| "…" is a text tag: only the Last value calculation can be used. | Set the calculation to Last value. |
| No text written and no tag bound. | Fill in the Text slot or delete it. |